

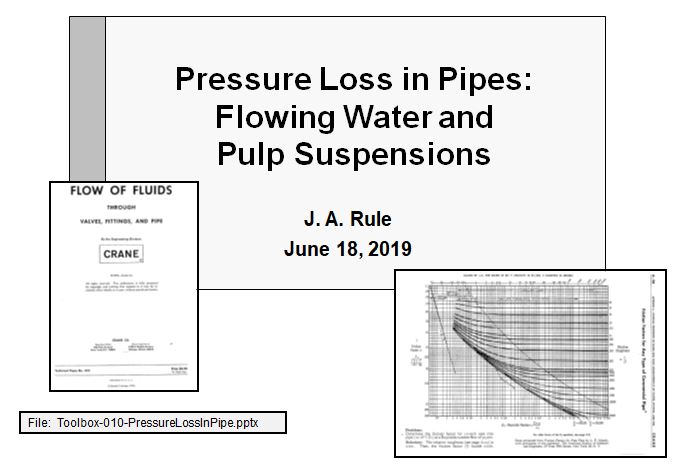
PowerPoint Presentations: This category contains PowerPoint presentations that give you background and guidance on selected topics. Some topics are general and some topics are very specific. Here is a typical title-page of a presentation:
Pressure Property Notes — This is a good place to start for students. Pressure sounds EASY, but there are differences between absolute pressure, gauge pressure, and differential pressure. Real-world situations and pitfalls are presented.

Volume Property Notes — This is a good place to start for students. Volume is a familiar property already. This presentation explains the differences and similarities of volume, specific volume, and density.
Piston-and-Cylinder Example Problems — Static slides for 5 sets of video example modules.
How to Interpolate. If you are taking thermodynamics, or if you are working in industry, you’ll need to learn how to interpolate between values in tables. This presentation gives you the methods for interpolating, coupled with helping you see if your result makes good common sense.
Propane Tank Demos. Static slides for a set of three videos illustrating some basics about a liquid/vapor mixture of propane and how to make basic engineering calculations to pinpoint the state of the propane.
Polytropic Process Notes. A daunting process path in thermodynamics is: PV^k = constant, where k is a number between 0 and 2. This presentation gives you tips on how to work with performing integrals on polytropic processes, and why it’s so important that you understand what you’re doing.
Kinetic Energy Notes — Working with kinetic energy is easy to understand, but getting the units aligned with related terms can be tricky. This presentation provides step-by-step notes, and example problems, for both SI and English units.
Rotating Power Notes — The power delivered by a steady rotating shaft is described by Power = Torque x Speed. Sounds easy, but getting the units straight can be tricky. This presentation provides background on the difference between work and power, provides basic guidance on units associated with power, torque, and speed in both SI and English units, and illustrates the concepts with two example problems.
EIA (U. S. Energy Information Administration) — gold mine for energy information in U.S. Check out this presentation, which provides four case-studies to illustrate how the EIA data can be used to illustrate various aspects of energy usage, and trends, in the U.S.
Test and Quiz Success Tips: Check out this set of tips for preparing and taking a test or quiz. Learn how to MAXIMIZE partial credit. Learn how to best use the allotted time. Learn what to do when you’re “stuck”.
Tips for Building Your Own Brand. This presentation provides ideas of how you should quickly understand that YOU have control over the way OTHERS perceive you. If you develop good work habits, work with integrity, respect others, take responsibility, and strive for excellence, you’ll have your own “brand” that you can be proud of.
Background on Vapor Compression Refrigeration Cycles. What do the components look like? How do they work together? What is a chiller and what is its purpose? What is the difference between a Refrigerator and a Heat Pump?
Psychrometric Starter Kit. Browse this file to understand the fundamentals behind “atmospheric air”, the mixture of dry air and H2O vapor. Gain an understanding of “relative humidity”, “humidity ratio”, “dew point temperature”. Example problems demonstrate how you can begin to analyze engineering situations associated with heating, air conditioning and atmospheric phenomena. Learn how to use the “psychrometric chart” for quick property evaluations.
Entropy Notes. A set of notes to help you understand the property “entropy”. How does entropy relate to order-and-disorder? What are some tips for quantifying entropy changes for a process?
Tips for building effective Excel applications. Ideas for “working down the page” and explaining your work.
How to create and deliver effective presentations. It looks easy, but it’s harder than it looks. Your professional progress can be strongly influenced by your ability to create and deliver an effective presentation.
Success Tips. This is a summary of a report by a JMU graduate, coupled with personal tips from young engineers at Westvaco/WestRock.
Return on Investment. Gives background and an example of the “time-value-of-money”. You can differentiate yourself by combining your engineering analysis and design skills with the ability to make recommendations based on your employer’s rate of return on a capital investment.
Centrifugal pump calculations. Shows what’s behind the basic computation of pump power requirements. Also, gives reference material on NPSH (net positive suction head) and explains the important difference between NPSHr (required) vs NPSHa (available), and how to determine both.
Compressed air calculations. Provides background and an example for calculating the power required (and cost per hour) for operating an air compressor. This can be a huge cost for industrial situations. Enables you to determine cost-savings for a proposed reduction in compressed air usage.
Pressure Loss in Pipe. Gives background on d’Arcy’s equation for pressure loss in piping. Reviews how “Reynolds Number” is used in determining the friction factor “f” in the head loss equation. Gives an example for situation where flow is known (find pressure loss — easy) and situation where pressure loss is known (find flow — harder).
Steam Tables Starter Kit. This presentation introduces the ideas behind the macro-enabled (xlsm) Excel file. Thermodynamic properties of water and steam (steam tables) are tabulated. Excel custom formulas have been created so you can call a custom formula (like h(P,T) for enthalpy of a superheated vapor for automated double-interpolation within the superheated table. Basic linear interpolation schemes are used to create the custom formulas. Use Save As… to start with this basic package, and then use the custom formulas as you develop your own thermal systems model. Updated 10/2022 with Moran and Shapiro steam tables as source data.
Air Tables Starter Kit. This presentation introduces the ideas behind the macro-enabled (xlsm) Excel file. Thermodynamic properties of the ideal gas air, modeled as having variable specific heat are tabulated. Excel custom formulas have been created so you can call a custom formula like h(T, “SI”) for enthalpy of air with SI units. Basic linear interpolation schemes are used to create the custom formulas. Use Save As… to start with this basic package, and then use the custom formulas as you develop your own thermal systems model. Source data is from Moran and Shapiro air tables (both SI and English).
Regression and Correlation. Gives you a review of what’s behind linear regression and how to interpret the results. Provides an overview of how to use the Excel regression tool. Reviews how “correlation” does not necessarily mean that x “causes” y to happen, just that they are correlated numerically.
How to calculate the Lineal Footage in a Paper Roll. Handy for working in paper mills and converting plants.
Steam Power Plant Notes. Browse this presentation to gain an understanding of “how a steam power plant works” and what the components look like. Gain an understanding of thermal efficiency and how thermal efficiency is maximized.
Power from Steam. Gives the thermodynamic background and examples on the way steam is used to produce power, throughout manufacturing and industry. Gives worked-out examples of “how much steam do I need (lbm/hr) to produce a certain amount of power (hp or MW)?
Hypothesis Testing Roadmap. This is a handy one-page “roadmap” when you are faced with a statistical analysis. There are lots of ways to get off-track when applying statistical analysis tools to a real-world analysis problem. You need to have some familiarity with statistical analysis tools, but the roadmap helps to keep things straight and will help you to explain to others how you selected the analysis tools for the job.
Compare Two Data Sets. This is a classical, simple statistical analysis that sounds easy, but it can be very subtle and tricky. This is also a classical industrial request, “Is there a statistical difference between Situation A and Situation B?” This presentation provides you with ideas on how to get started, how to perform the analysis, and how to explain your conclusion to others.
Digitize Graphic Curves. How many times do you wish you had an analytical “formula” (y vs. x) that describes a curve that you see on a paper or electronic graph? This presentation shows you how to use a freeware program to digitize any curve from a scanned-in image of your graph. You won’t believe how easy it is, and how this can reduce your manual labor of looking up values from a graph.
Using Excel Goal Seek. The presentation describes a very handy built-in Excel tool when you have a “formula” but you cannot solve it explicitly into a y=f(x) “formula”. Many engineering problems involve “guessing” a value for the solution, and you have to keep guessing over-and-over. If you can write an equation where the left hand side is: 0=(your formula that depends on x), then you can use Goal Seek to keep automatically guessing x until the left-hand-side equals zero.
Video Links Technical. This presentation provides you with mostly YouTube video links which illustrate lots of equipment and systems encountered by mechanical engineers in their careers. Lots of the videos are down-right fun to watch, and can be educational as well. It’s a way to see “what does it look like”, going beyond textbook material.
Colin Powell Leadership Secrets. General Powell was a tremendous leader, both in the military and in government service. He leaves a legacy and inspires the best from all who are interested in his ideas. This presentation is a summary of one of his books.
Greatest Graphic Ever Made (?). This presentation summarizes the graph that many people think was the “greatest graph ever made” because it communicated so much information in such a small space. And you’ll learn a little history as well. The graph was created by a young engineer working for Napolean on his march to and from Moscow during the war of 1812. It’s worth a look into this intriguing story
Incompressible Nozzle Flow Notes. This is a summary of a “special case” of water (modeled as an incompressible fluid) flowing through a converging nozzle. The best real-world example of this situation is the nozzle of a fire hose. As a thermodynamics student, you will have the skill to determine the pressure loss (psi) across the nozzle for a known flow (lbm/hr).
What is a State? What is a Phase? This presentation provides a refresher and examples regarding, “What is a State?” and “What is a Phase?” Examples and guidance are provided for improving your skills in using thermodynamic property tables (steam tables) and identifying the phase of a substance. Learn how to get better at quickly identifying a saturated liquid, saturated vapor, saturated 2-phase mixture, compressed liquid, or superheated vapor.

Ideal Gas Tips. Key fundamentals behind the ideal gas model are presented. What is the ideal gas equation of state? What is Cp? What is Cv? When are these constant? Variable? When are they needed?
What is the First Law of Thermodynamics for a closed system? Tips for determining the work done by a system, the internal energy change of a closed system, and the heat added to the system during a process. Learn why identifying the “substance” involved in the system is so important to solving engineering problems.
Cooking With Steam. This presentation uses “cooking with steam” to illustrate the different phases of water and steam as you go from tap water all the way to boiling all the water out of your steam pot on the stove. It’s a way to relate your textbook material to a real-world situation you’ve observed time-and-time again.
Power vs Work. Most young engineers have a tough time grasping the difference between work and power. Work can be visualized as the act of lifting a weight from one position to a higher position (units: ft-lbf or N-m). Power is the RATE at which work is being done (units: ft-lbf/sec or hp or N-m/sec or kW). Even experienced engineers get these confused, much to their discredit. Check out this presentation where work and power are compared and constrasted.
“Delta u” and “Delta h” Tips. You must quickly understand the difference between (U and u) and (H and h). Many student have a tough time knowing “when do I use u” and “when do I use h”? Check out this presentation where this is explained and example problems are provided. Hint: Practicing engineers call both U and u “internal energy” and H and h “enthalpy” because of using them so much. That’s something that young engineers must pick up quickly and understand the differences.
Three Process Cycle Demo. A cycle consisting of three simple processes is proposed. This presentation works through the entire cycle analysis, explaining each step along the way. Check out this example problem to improve your understanding of “net work”, “heat added” and “heat rejected” and how to use thermodynamic principles to determine them.
Thermodynamic Cycle Basics. (Crash Course) – Review this presentation for a quick review of the three types of thermodynamic cycles: power cycle, refrigeration cycle, heat pump cycle. See how to compare the measures of performance. Review the usefulness of the first law of thermodynamics as it applies to cycles.
Using Carnot Cycle Fundamentals. This presentation starts with the basics of defining thermal efficiency or coefficient-of-performance for a thermodynamic cycle. Examples are provided to illustrate how you can determine the best possible performance for certain proposed situations. This is a mechanical engineering skill that can pay off for you for years to come.
Transient Process Basics — Learn how to work with the “general” statement of the first law of thermodynamics (energy balance) for an open system. When an open system (control volume) process is NOT steady state, steady flow, then you must start with the general statement of the first law and include the dE/dt (rate of change of the control volume) term.
Statistical Process Control Starter Kit. Learn the background for setting up a Statistical Process Control “Run Chart” and tracking the performance of any process. SPC (statistical process control) is used throughout the manufacturing industry to detect when a process is operating outside of normal expected variation, and provided quantitative guides for taking process modification actions.
Greek Letter Examples. What are all those “strange looking letters” that appear in various engineering relationships? Chances are these are Greek letters that you might (or might not) recognize. This presentation provides you with the names for all the Greek letters and provides specific examples of how they are commonly used in engineering.
Tips for Engineering Course Tutors — This presentation provides general ideas, along with specific tips, for individuals serving as tutors for undergraduate engineering courses. The material is based on the author’s experience and opinions about tutoring. It’s a win-win experience. Both the student and tutor improve as a result of this service.
Vortex Tubes and Coolers — What is a vortex tube? This novel device can turn a supply of compressed air into a stream of cool air and warm air. And with no moving parts. How is it possible? This presentation provides background on vortex tubes and coolers, shows how to analyze if the process is possible or impossible, and candidate suppliers for vortex tubes and coolers.